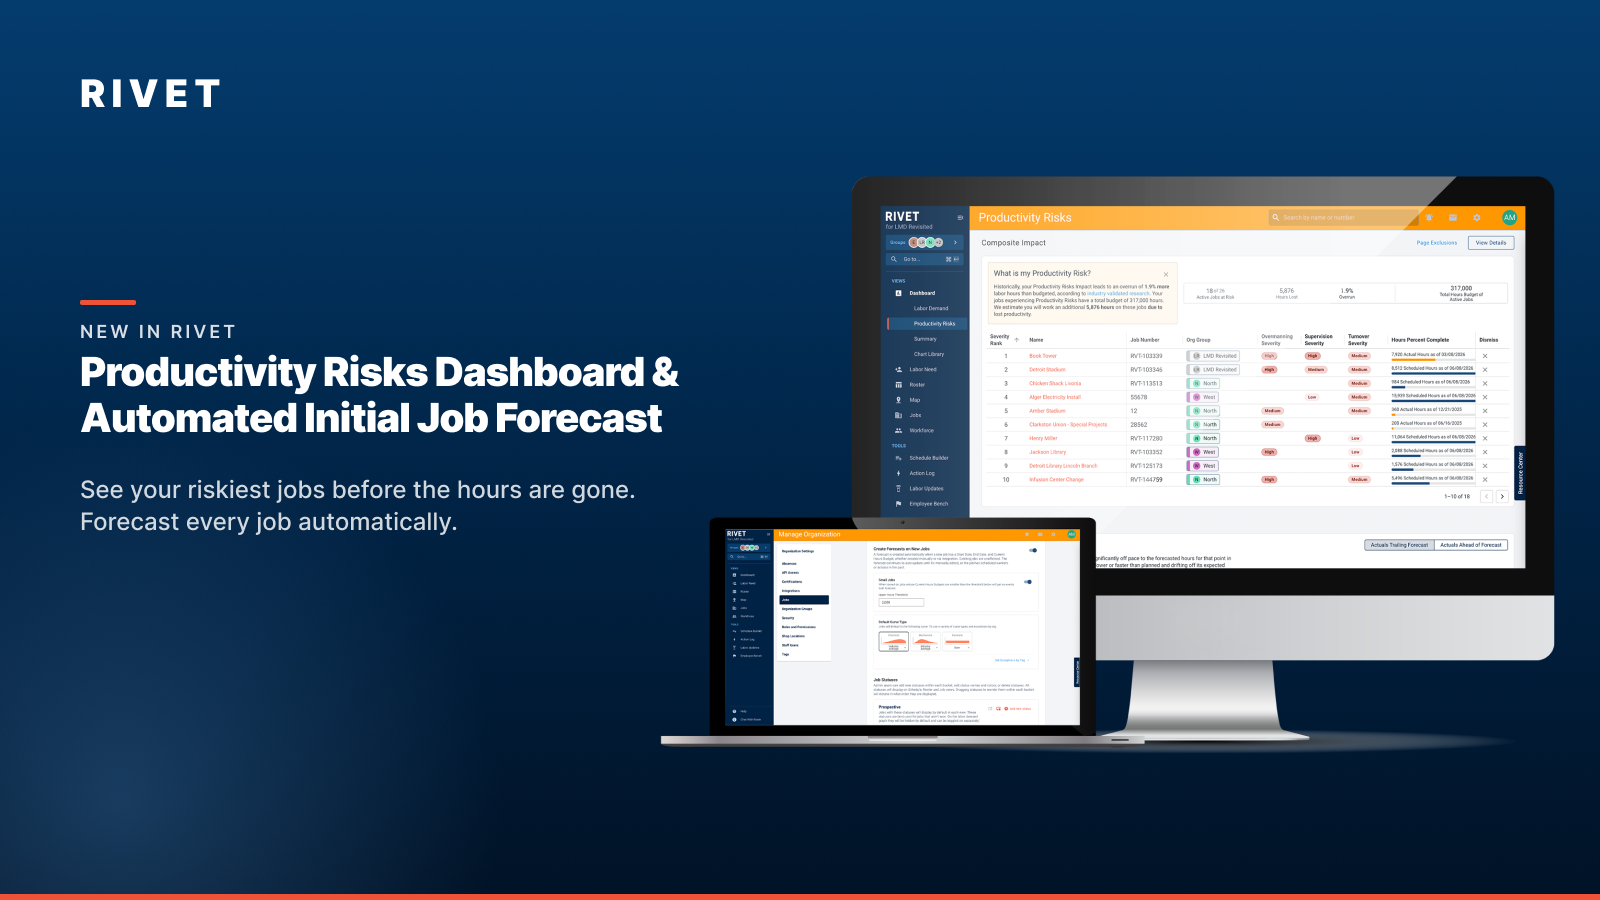
Productivity Risks Dashboard & Automated Initial Job Forecast

.png)

See your riskiest jobs before the hours are gone. Forecast every job automatically.
Most construction jobs run over. Industry benchmarks and RIVET's own data land in the same place: the typical job comes in around 7% over its labor hour estimate, and the best-run shops fight to keep that number under 5%. That gap is the difference between a healthy year and a painful one, and for most contractors it stays invisible until the actuals come in and the month is already closed.
Today we're changing that. The new Productivity Risks experience in RIVET flags your riskiest active jobs, quantifies the impact in hours, and points you to the exact factor creating the risk, while you can still do something about it. It's part of our June 16, 2026 release.
Margin fade isn't random
The most important thing we learned building this is that labor overruns aren't bad luck. They're not the weather, and they're not always the GC. Most of the overrun traces back to a small, repeatable set of decisions about how labor gets loaded onto a job. Decisions that, if you can see them early, you can actually fix.
That's the whole idea behind Productivity Risks. Instead of explaining lost hours after the job is over, RIVET surfaces the leading indicators while the job is still in flight, so the conversation with your GC or your own ops team happens before the cost compounds.
Built on real research, validated on real jobs
Productivity Risks is built on the canonical labor-productivity research in our industry: Dr. Awad Hanna's studies for NECA (ELECTRI) and the MCAA, which identified more than a dozen factors that erode field productivity and quantified their impact across more than a hundred real projects.
That research has been sitting on the shelf for years because it's been largely theoretical for most contractors. As one put it, "you have to be a rocket scientist to use this stuff." We did the rocket science. RIVET re-validated Hanna's findings against anonymized data from tens of thousands of completed projects, representing over 100 million hours of work, confirmed the effects still hold in 2026, and turned them into live flags on jobs that are still running.
We went deep on three factors first, because they're the three you can see, measure, and act on directly inside the RIVET scheduling and forecasting platform.
The three productivity killers
Overmanning. Stacking more workers on a job than the plan can productively absorb. It usually shows up as a recovery move: the job is behind, so you throw people at it. Past a certain ratio of peak workers to planned average, coordination overhead starts eating the gains. Crews compete for space, materials, and supervisor attention. Hanna documented productivity losses from 15% in minor cases to 33% in severe ones. In RIVET's data, jobs that crossed the line ran roughly 15 percentage points worse on hours efficiency. On a $1M labor budget, that's about $150,000 of overrun driven purely by how the labor curve was loaded.
Dilution of Supervision. Supervisors stretched too thin to actually supervise. It often rides along with overmanning, but it's a distinct failure: you add bodies without adding foremen, and one field leader is suddenly running a crew twice the size they should. In Hanna's framing, supervisors become "ineffective in two separate areas instead of being productive in the one originally-planned area." They stop leading and start firefighting. Decisions queue up, rework grows, safety exposure climbs, and coaching disappears. RIVET's data showed diluted jobs running about 4 percentage points worse on hours efficiency. On a 10,000-hour job, that's 400 extra hours because the foreman couldn't be in two places at once.
Turnover (Loss of Learning). The churn of workers on and off a job. Construction is a learning-curve business: a crew that's been on a job for six weeks is materially more productive than the same crew on day one. Every time you cycle in a new face, the job pays the ramp-up cost again, and the crew absorbing them installs less while they onboard. Jobs that churned through more than double the unique workers their peak actually required ran about 10 percentage points worse than jobs with stable crews. Unlike overmanning, the effect held across job sizes: workforce churn hurts a 1,000-hour service job and a 50,000-hour stadium alike.
In the jobs that really blow up, you usually see two or three of these reinforcing each other. The schedule slips, so the contractor overmans, which dilutes supervision, which drives turnover, which resets the learning curve. That's why Productivity Risks rolls them into a single composite view: one risk factor at moderate severity is worth watching, but a job carrying all three is almost certainly already bleeding hours.
What you actually get
A portfolio dashboard. A new sub-page on your RIVET Dashboard ranks every active job by composite severity (Low, Medium, High), so you start at the top of the list and work down through the jobs doing the most damage. Drill into any job to see which killer is responsible.

Impact measured in hours. We quantify the projected overrun in hours, not dollars or percentages, because hours are the currency of construction labor. When the dashboard tells you your at-risk jobs are projected to burn thousands of additional hours, that's a number your superintendent and your CFO can both act on.
Insights on the job homepage. PMs and superintendents don't have to go hunting on a dashboard. A Productivity Insights panel lives on every job homepage, surfacing the same risk signals in context, plus slippage (the leading indicator that a killer is forming) and schedule variance. Every card links directly to the place in RIVET where you can take corrective action, whether that's the job plan, the schedule, or labor planning.
Controls that respect how you run. Some jobs are bought to be overmanned, and some trades run hotter than others. You can dismiss jobs that don't fit your context, either against a budget threshold or with a custom dismissal reason, and set an org-level hours threshold to filter out the small jobs that aren't worth flagging.
Every job carries a forecast. Productivity Risks is only as good as the plan it reads. Shipping alongside it in the same June 16, 2026 release, Automated Initial Job Forecasting builds a forecast automatically when a job is imported or created (as long as it has a start date, end date, and hours budget), using a default curve your Admin sets or curves mapped to your Display Group Tags. The forecast keeps itself current as the schedule or budget changes. Once a job logs real hours or you edit it by hand, RIVET steps back and the plan is yours. The net effect: every job carries a live plan the risk engine can measure against, with no one having to sit down and build it.

Get started
If you're an executive or operations leader, start at the top of the composite impact table and work down through the high-severity jobs. If you're a PM or superintendent, the panel is already on every job you own. For the full rundown of everything shipping in this release, read the 6.15.26 release notes.
Want help reading the rankings against your own portfolio, or setting thresholds for your trade mix? Reach out to your CSM. And if you're not on RIVET yet, talk to someone who gets it.
The biggest line item on your P&L is finally visible before the month closes. Let's use it.
Further reading: 6.15.26 release notes and Why Construction Jobs Run 7% Over: The Research Behind Productivity Risks.
Ready to ditch the chaos?
Join specialty contractors just like you who stopped accepting "that's just construction" as an excuse for losing money.