Webinar Recap: Productivity Risks & Automated Forecasts

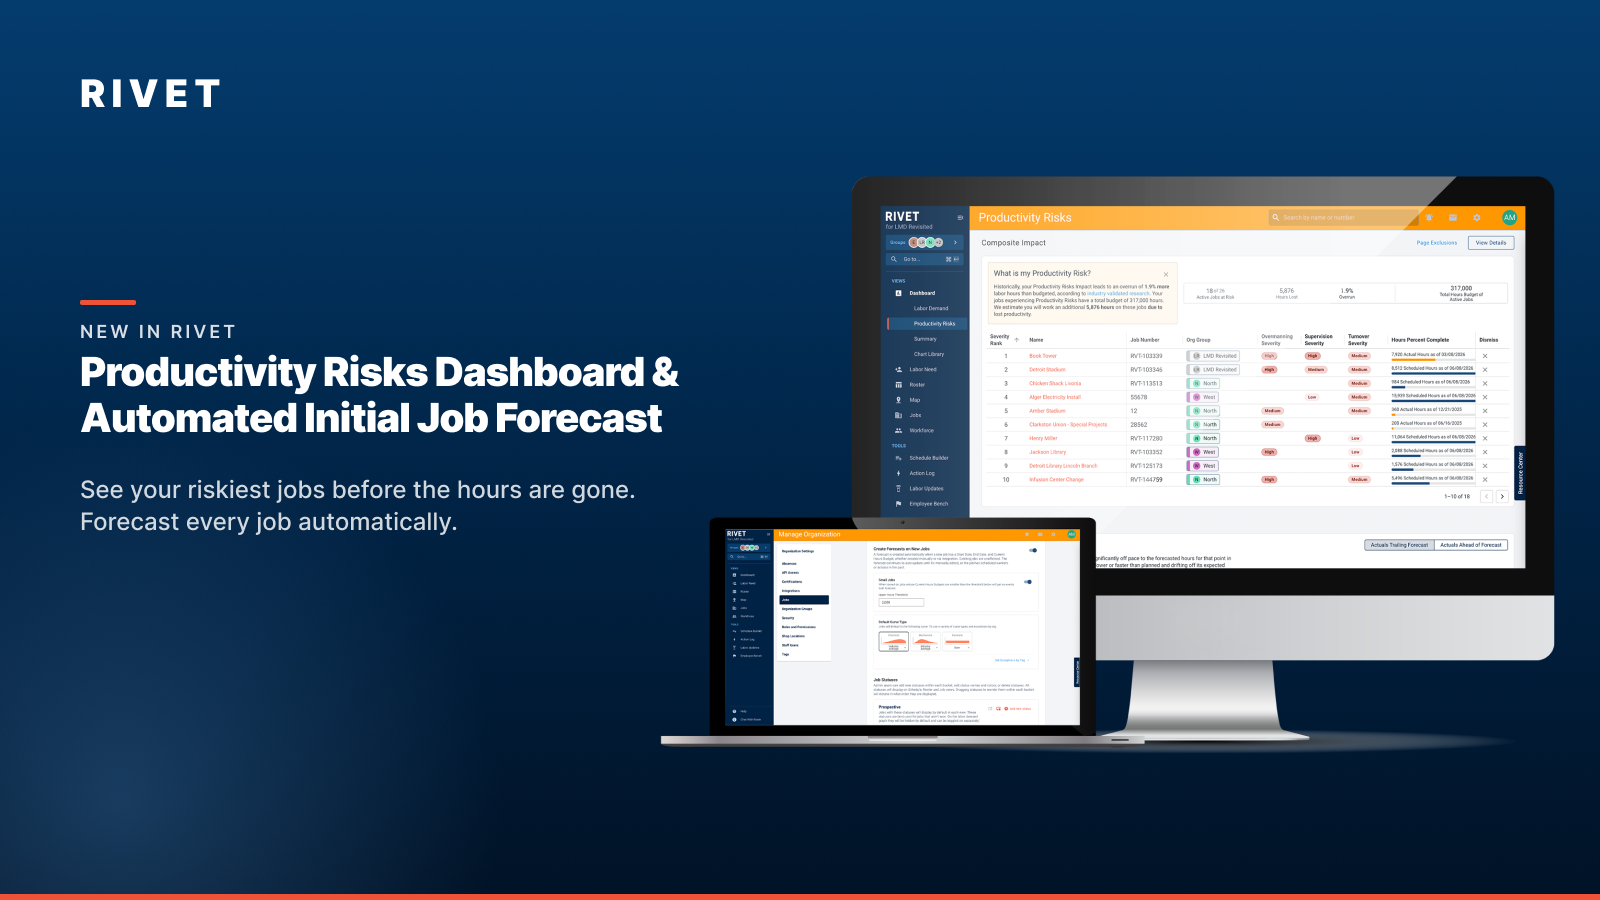

Thanks to everyone who joined our latest What's New in RIVET webinar. We walked through two features built to help contractors stay ahead of labor risk without adding manual work: the Productivity Risks Dashboard and Automated Initial Job Forecasting. If you couldn't make it live — or want to revisit anything — this recap has the recording, the resources we referenced, and answers to every question the audience asked.
Watch the recording
The full session is available on demand above, or watch it on YouTube.
What we covered
Productivity Risks Dashboard
The Productivity Risks Dashboard automatically surfaces the jobs most likely to erode productivity — and puts the worst offenders first. Each risk is rated high, medium, or low based on how far a job crosses that risk's threshold and how long it stays there. The more severe and more sustained the problem, the higher it climbs.
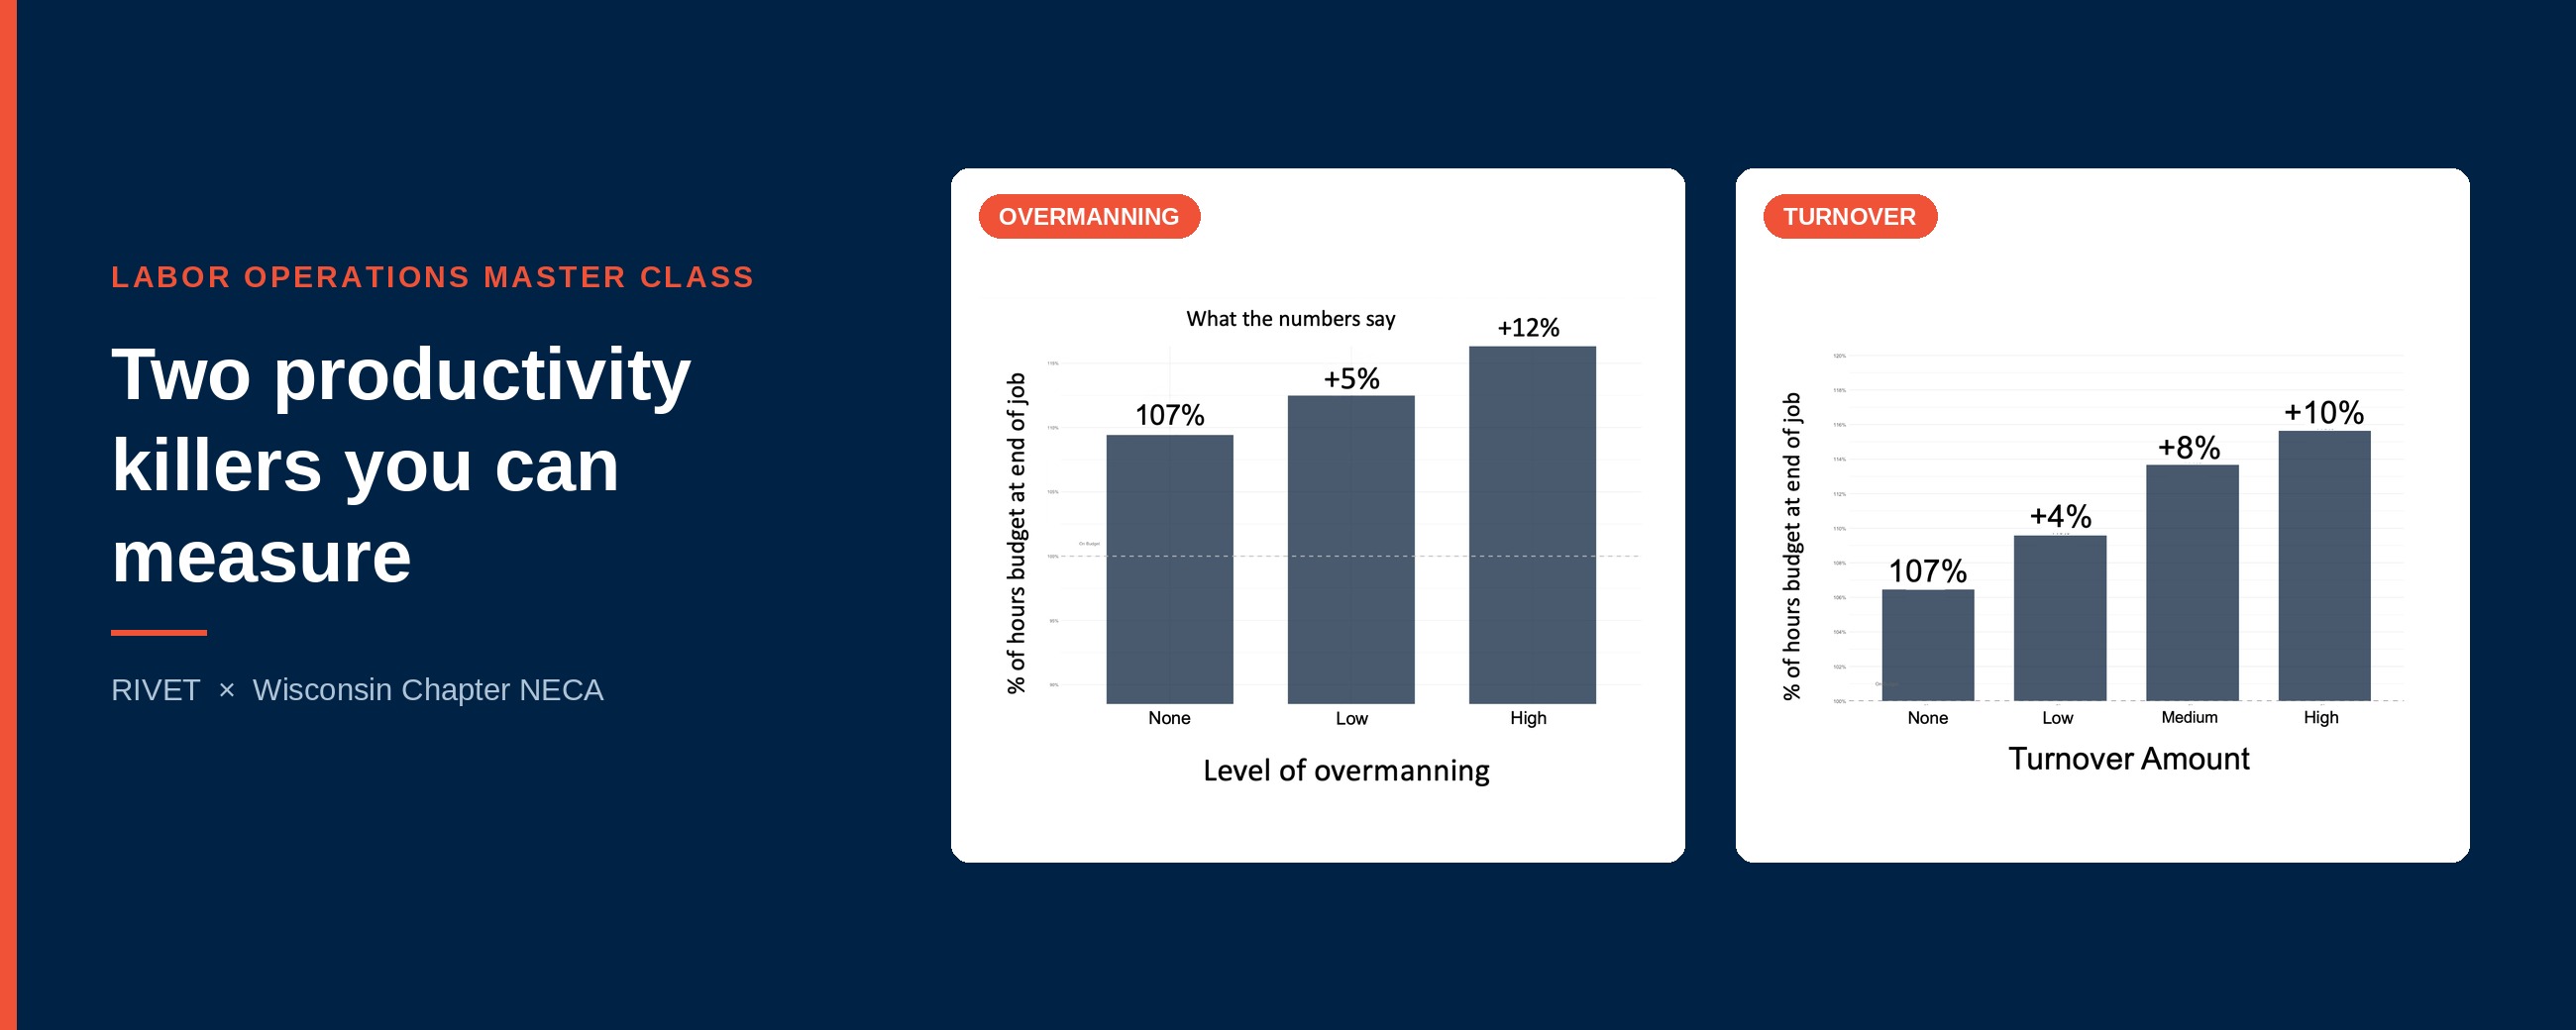
The dashboard tracks risks like overmanning (how many future weeks a job is overmanned combined with how far over the ideal crew it runs), supervision dilution (how far a crew runs above the ideal one-supervisor-to-six-workers ratio), and turnover, or loss of learning (how many different people cycled through a job compared to the peak crew you actually needed). Those thresholds are research-based and set to keep the math sound. Want the detail? Read the research behind Productivity Risks.
Automated Initial Job Forecast
Automated forecasting makes sure every new job has a plan — without the manual effort. Turn it on at the company level and jobs created afterward are forecasted automatically to their default schedule. Smaller jobs get an even-distributed forecast rather than a curve, and your manual forecasts are never touched. This matters for more than convenience: several Productivity Risks depend on having a forecast in place, so automating it keeps your risk picture complete.
Dig deeper
Explore the knowledge base guides and research:
- Automated Initial Job Forecast — knowledge base guide
- Productivity Risks Dashboard — knowledge base guide
- The Research Behind Productivity Risks — industry-validated research
Your questions, answered
We captured every question from the session. Here are the answers in full.
Automated Initial Job Forecast
Can we exempt a specific set of jobs from auto-forecasting entirely so they get no forecast at all?
Not as a per-job setting today. Automated forecasting is turned on at the company level, not job by job. Smaller jobs get an even-distributed forecast instead of a curve, but that's still a forecast. A job only ends up with none if it's missing the basics — like start and end dates or an hours budget. So there isn't a way right now to pick certain jobs and say "never forecast these."
If we've already manually edited a job's forecast, will automation come back and overwrite it?
No. Once a job has a manual forecast, automation leaves it completely alone — it won't override it or regenerate it. Auto-forecasting only ever manages forecasts it created itself. Your manual work stays exactly as you set it unless you choose to rebuild it.
On the version history, is it possible to know which user "triggered" the automated forecast?
Not directly at the moment. We're working on adding this to our action log, which should help track the type of action that caused an auto-forecast to be created or re-forecasted.
If I enable the automated forecast, will it let me select a 4/10 work schedule, or does it default to 8/5 and require me to update afterward?
Yes — when creating the job you can set up the default schedule and it will auto-forecast to that schedule. If, while a job is still being auto-forecasted, you change the default schedule to 4/10s, that triggers an automatic re-forecast.
If I toggle Automated Forecast on now, will it affect unforecasted projects?
No. When you toggle on Automated Forecasts in your Manage Organization settings, it only applies to jobs created after the toggle was enabled.
Productivity Risks Dashboard
What makes a risk show up as high, medium, or low — and can we configure those thresholds?
Every risk is rated based on how far a job crosses that risk's threshold and how long it stays there. More severe and more sustained pushes it toward high, and the dashboard automatically surfaces the worst offenders first. Severity works a little differently for each risk:
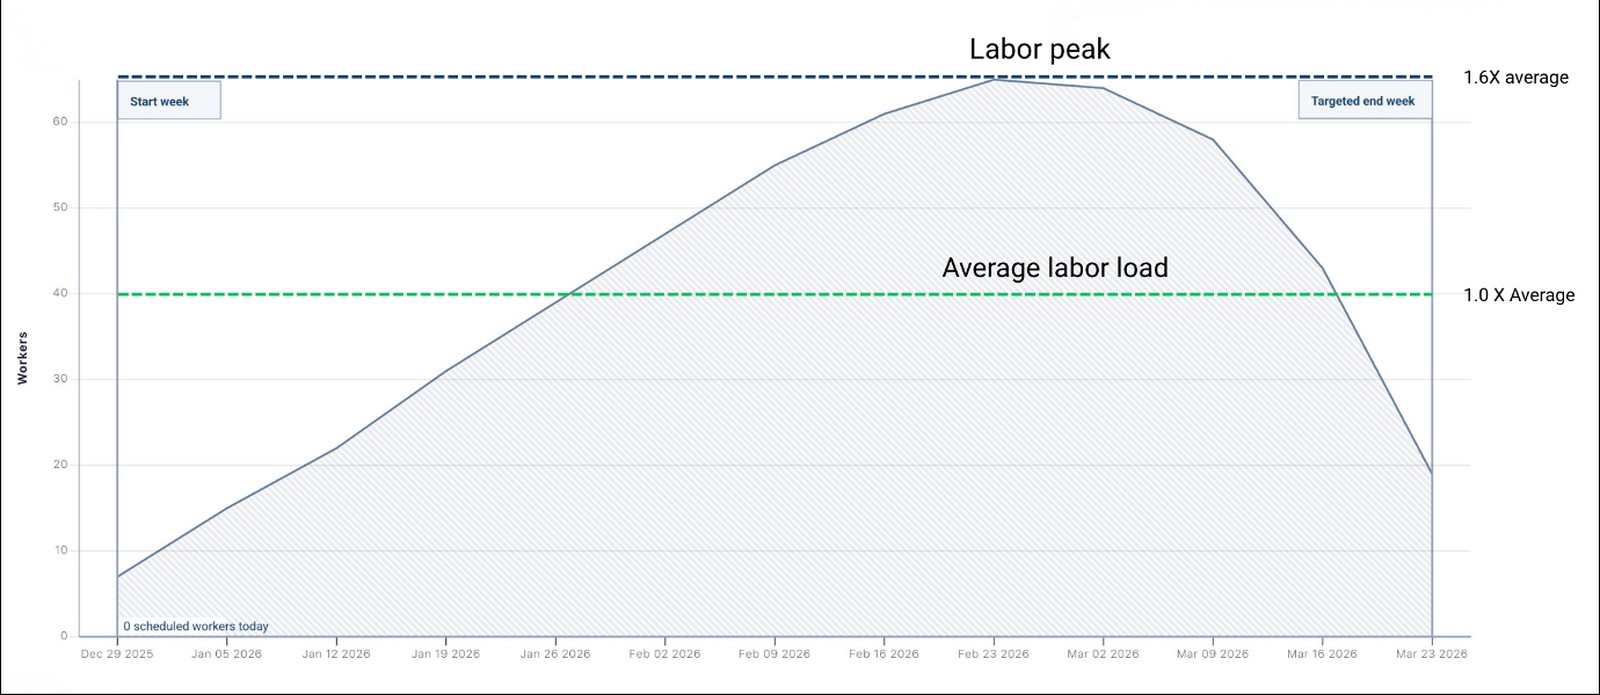
- Overmanning: we combine how many weeks a job is overmanned in the future with how far over the ideal crew it goes, then scale that against the job's length and planned crew size. More weeks and bigger overages push it toward high.
- Supervision dilution: we look at how far the crew runs above the ideal ratio of one supervisor to six workers, weighted by how many people are affected and for how many weeks. A crew running slightly over reads low; one running far over — say two-to-one or worse relative to the ideal — for much of the job reads high.
- Turnover (loss of learning): we compare how many different people cycled through the job to the peak crew you actually needed. If it's the same crew throughout, there's no turnover. Around fifty percent more people than your peak is a low-to-medium signal; churning through more than double your peak crew reads high.
Those thresholds aren't customer-adjustable today — they're set from the research so the math stays sound. What you can control is scope: you can exclude jobs by size and dismiss specific jobs you don't want flagged. Adjustable thresholds are something we're exploring for the future.
Do we need to be forecasting our jobs for the Productivity Risks Dashboard to work?
It depends on the risk. The forward-looking ones — planned overmanning, slippage, over- and under-scheduling, and stale forecasts — do need a forecast, since they compare your plan against what's actually happening. But supervision dilution and turnover are drawn from your schedule — who you've actually got assigned and in what roles — so those light up as long as you're scheduling your workers in RIVET, even without a forecast. The one requirement: a job needs either a forecast or a schedule to show up at all. To get the complete picture you'll want both — and that's exactly why automated forecasting helps, because it makes sure every job has a plan without the manual effort.
Have more questions?
We'd love your feedback on this session — take our quick survey. And if you'd like to see any of this in your own account, reach out to your RIVET team.
Ready to ditch the chaos?
Join specialty contractors just like you who stopped accepting "that's just construction" as an excuse for losing money.