
Re-forecast Your Job in One Click, and Keep the Plan You Bought in View

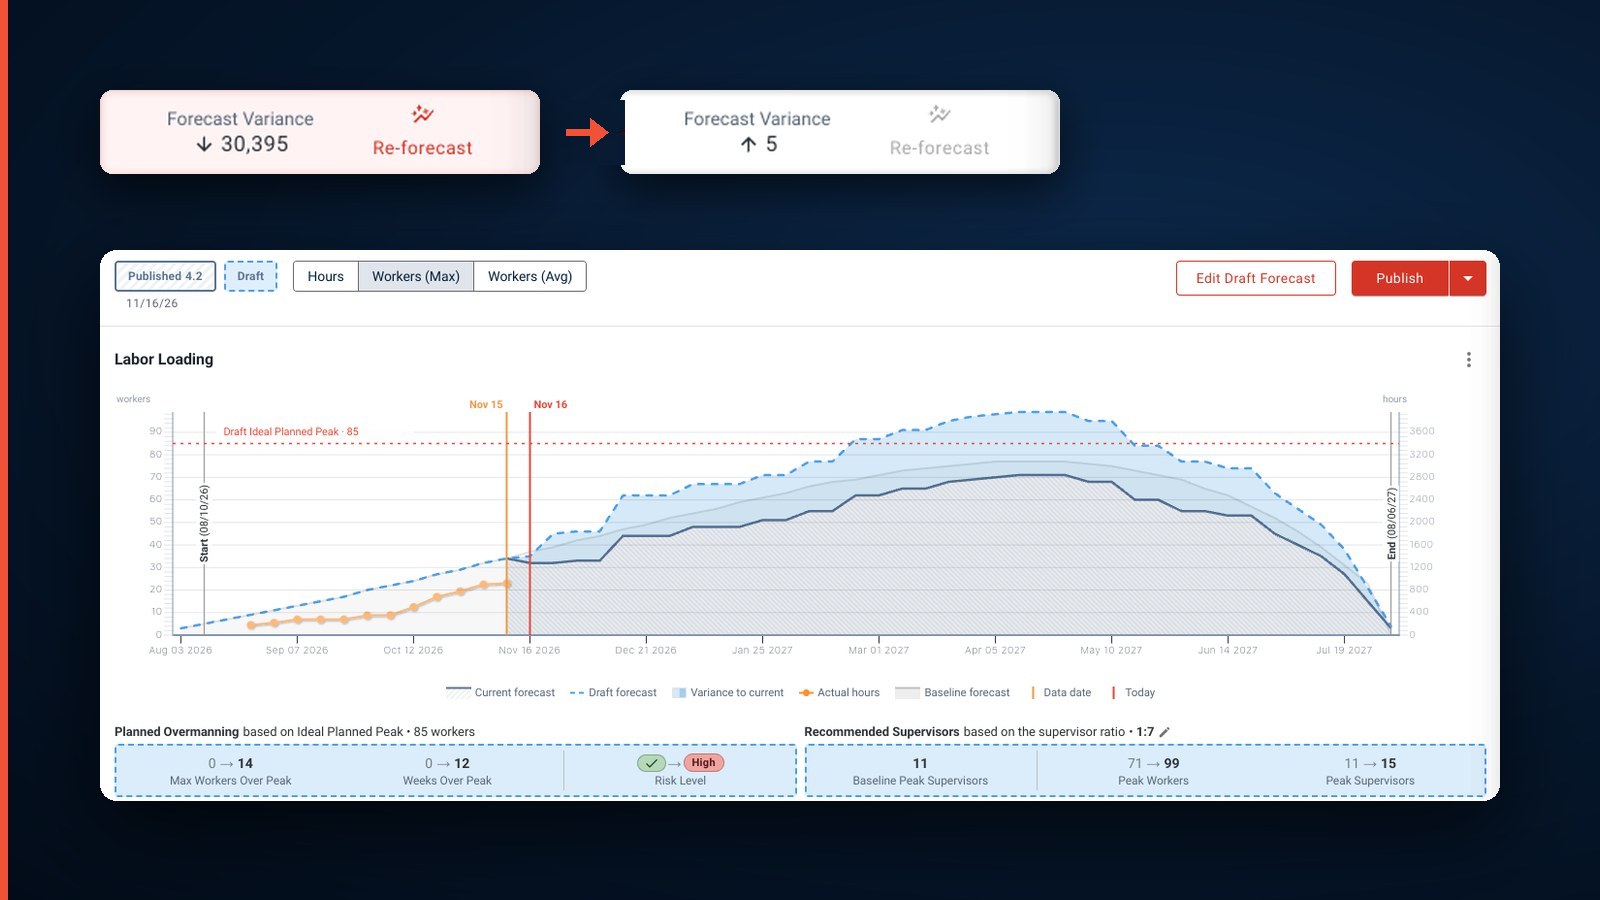



The new Job Homepage with Re-forecasting is now the default labor planning page for every RIVET customer.
It's Thursday afternoon, and the job has moved. Maybe the end date slid three weeks. Maybe 1,000 hours of added scope landed, or the crew started slower than planned. However it happened, your forecast no longer matches your projection. Fixing it used to mean adding workers cell by cell until the numbers added up. So forecasts drifted, and a lot of PMs went back to spreadsheets.
Keep your forecast current in one click
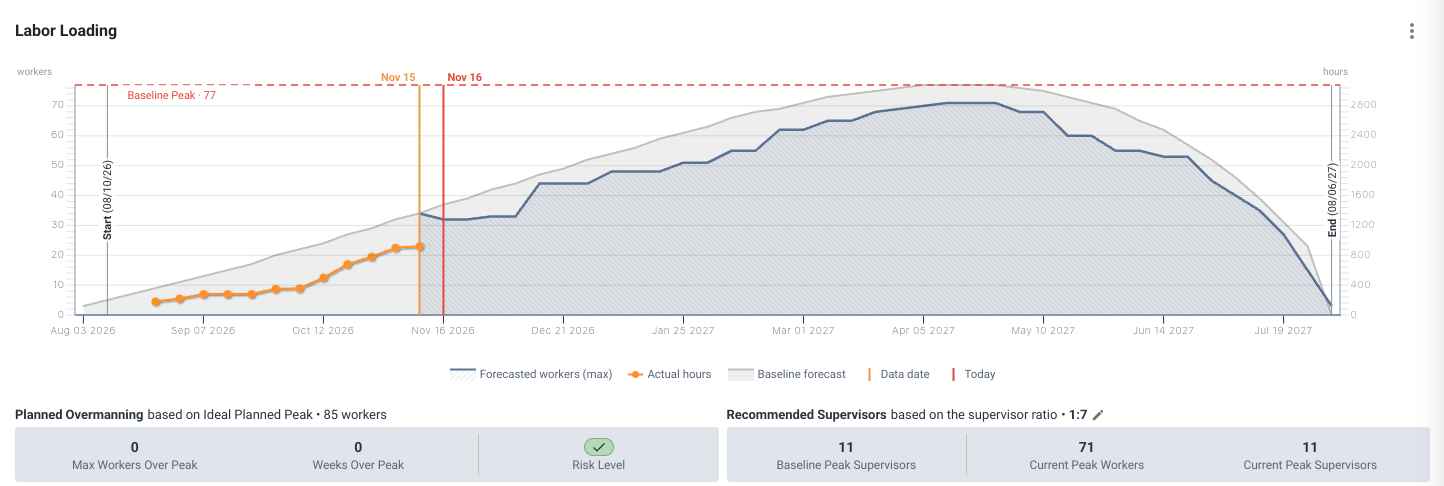
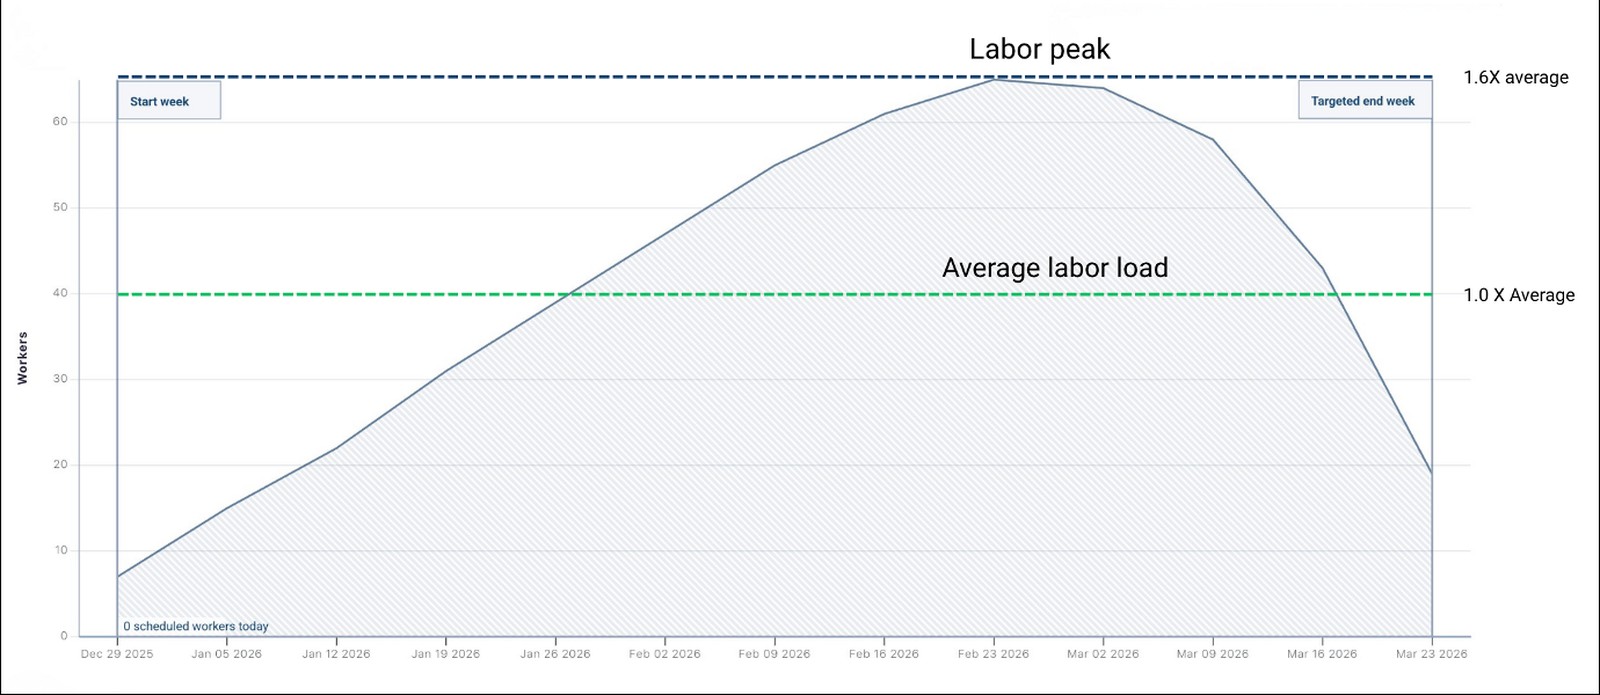
When Forecast Variance turns red, click Re-forecast. RIVET reshapes the rest of the job to land on your projected hours at completion, or on your hours budget if you don't manage a projection. It ramps from your actual hours and follows the shape of your existing labor curve.
 PUBLISHEDDRAFT RE-FORECAST
Need to hold the next few weeks as they are? Lock them, and RIVET only reshapes what comes after. Set a max-worker cap and it holds those weeks at the cap and spreads the overflow into lighter weeks.
The payoff goes beyond the PM. When forecasts stay tied to the projection, the labor demand your schedulers and ops leaders plan from stays accurate too.
See slippage against the plan you bought
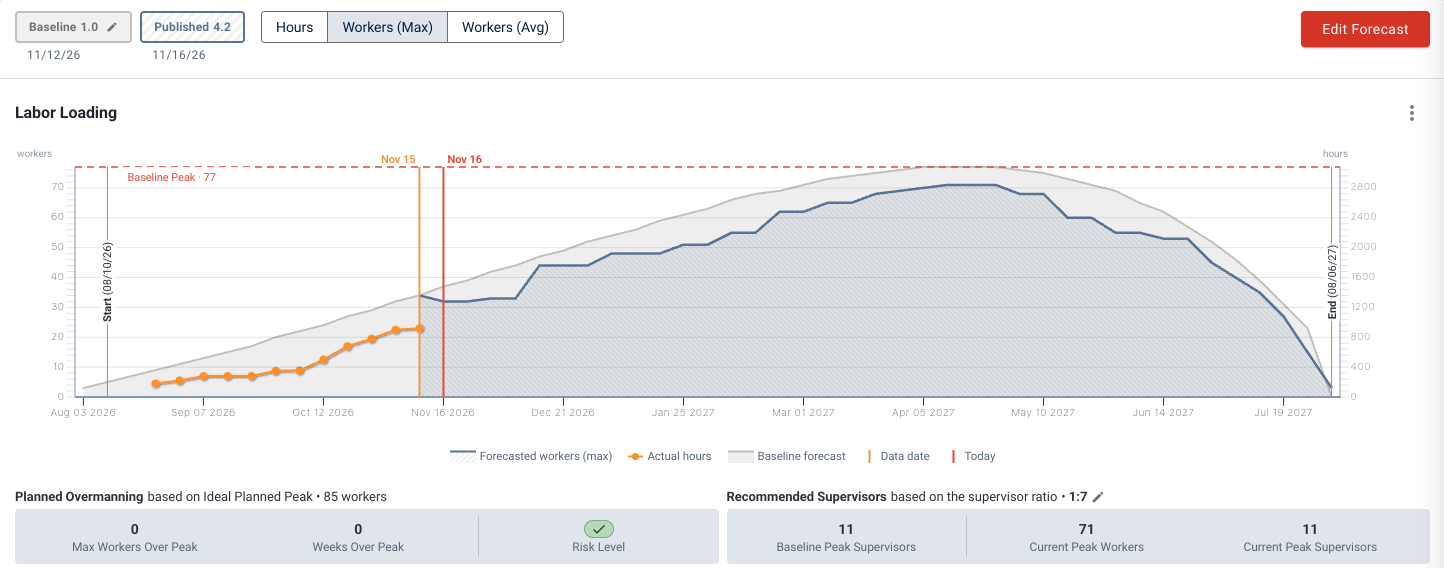
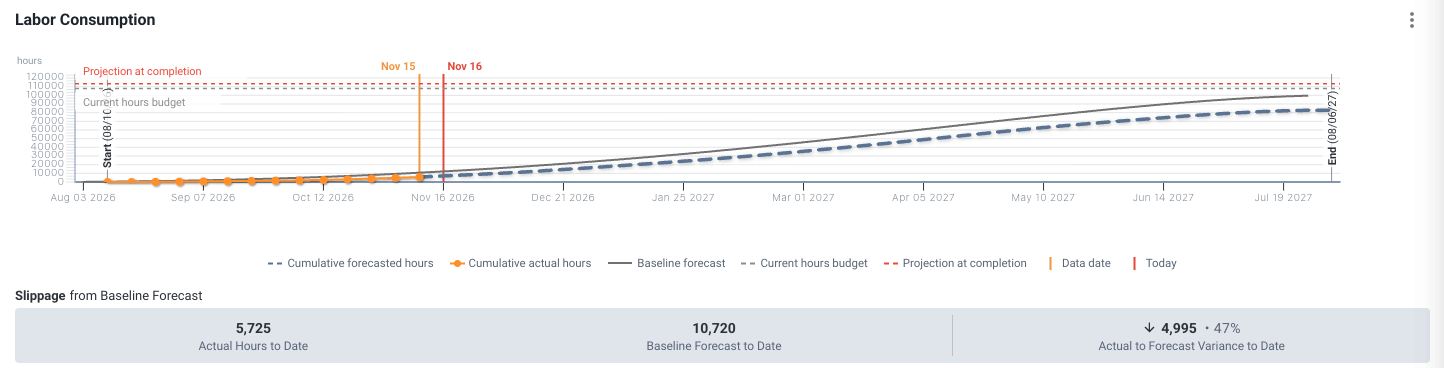
Before, every new forecast you published replaced the old one, so slippage always looked smaller than it was. Now your Baseline Forecast stays fixed on the chart next to your actuals and your current published forecast.
Know the risk before you commit
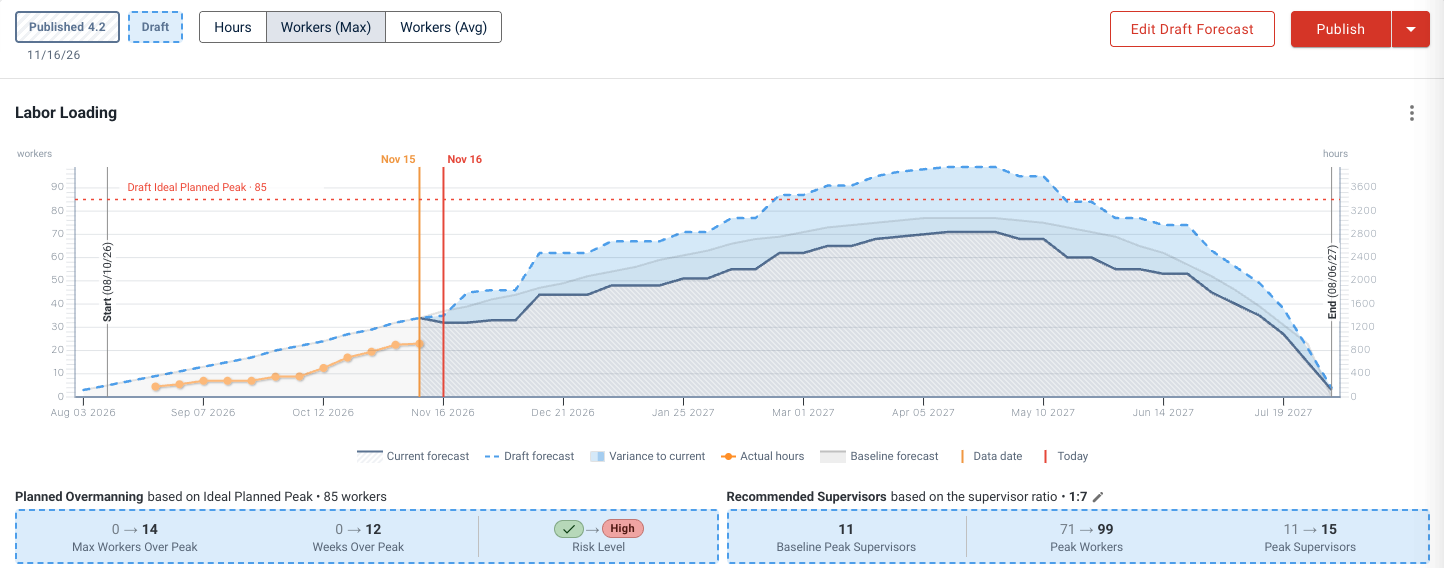
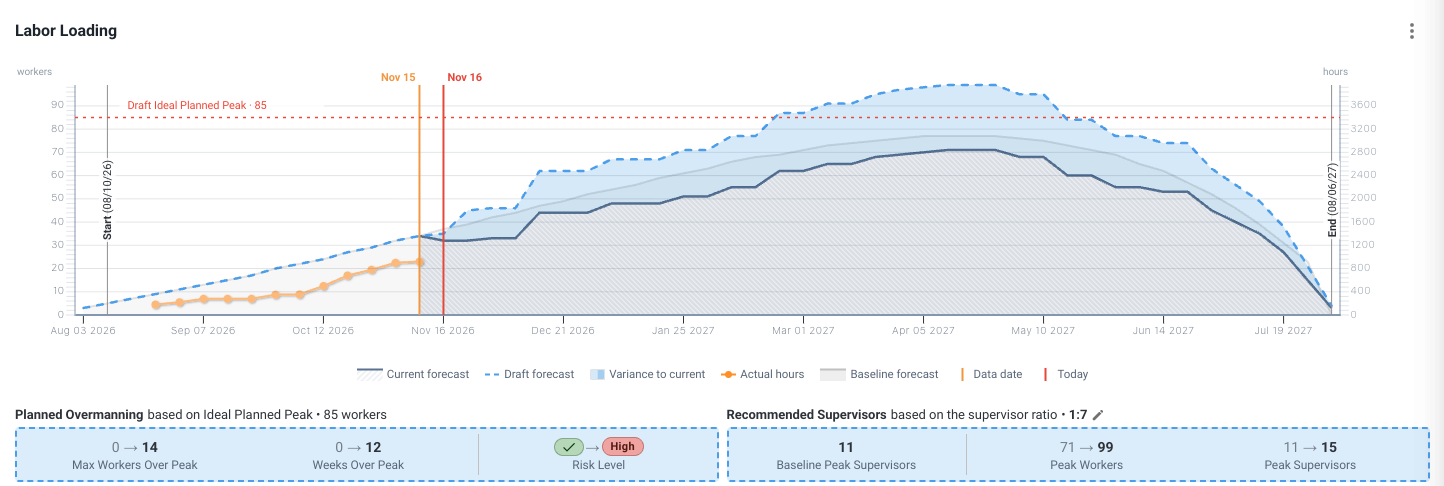
Every re-forecast starts as a draft. Nothing changes for your team until you publish. Change the projection, move the end date or set max workers, and you'll see planned overmanning and recommended supervisors update right away.


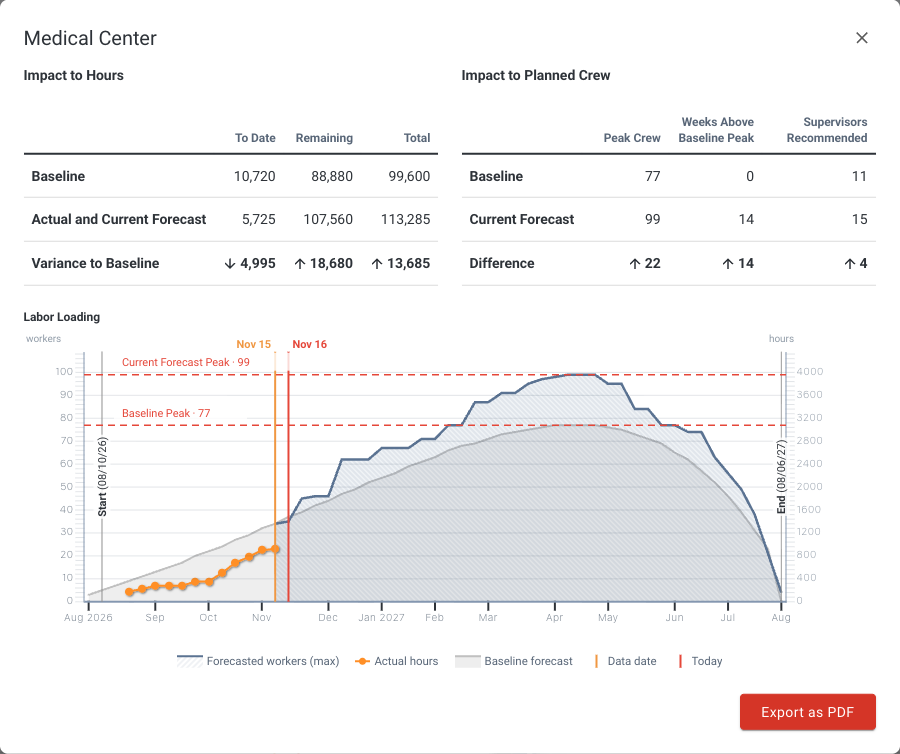
If closing the gap means 28 more workers at peak, four more supervisors and 12 weeks over your ideal planned peak, you'll know before you publish the plan, not in week six. Don't like what you see? Revert it.
Bring real numbers to the conversation
One PM told us that when productivity loss is only quantified at job close, it's "so much harder to get paid for that." View Impact compares your current published forecast to your baseline on hours, peak crew and recommended supervisors, and exports to PDF. You get a clear, documented picture of what the change did to your labor plan, ready while the change is still fresh: for the GC when it's a change order, or for your own ops team when it's a recovery plan.
Poynter Sheet Metal was already doing a version of this with RIVET labor curves before re-forecasting existed, and using it to get change orders approved:

“We’ve used those labor curves on a couple of jobs to show schedule compression and what it does to the number of people, to help execute change orders. When you cut two or three months off our schedule and the end date doesn’t move, this is the increased labor we’re seeing. We can show live data and what it’s doing to the job.”

What's on the new page
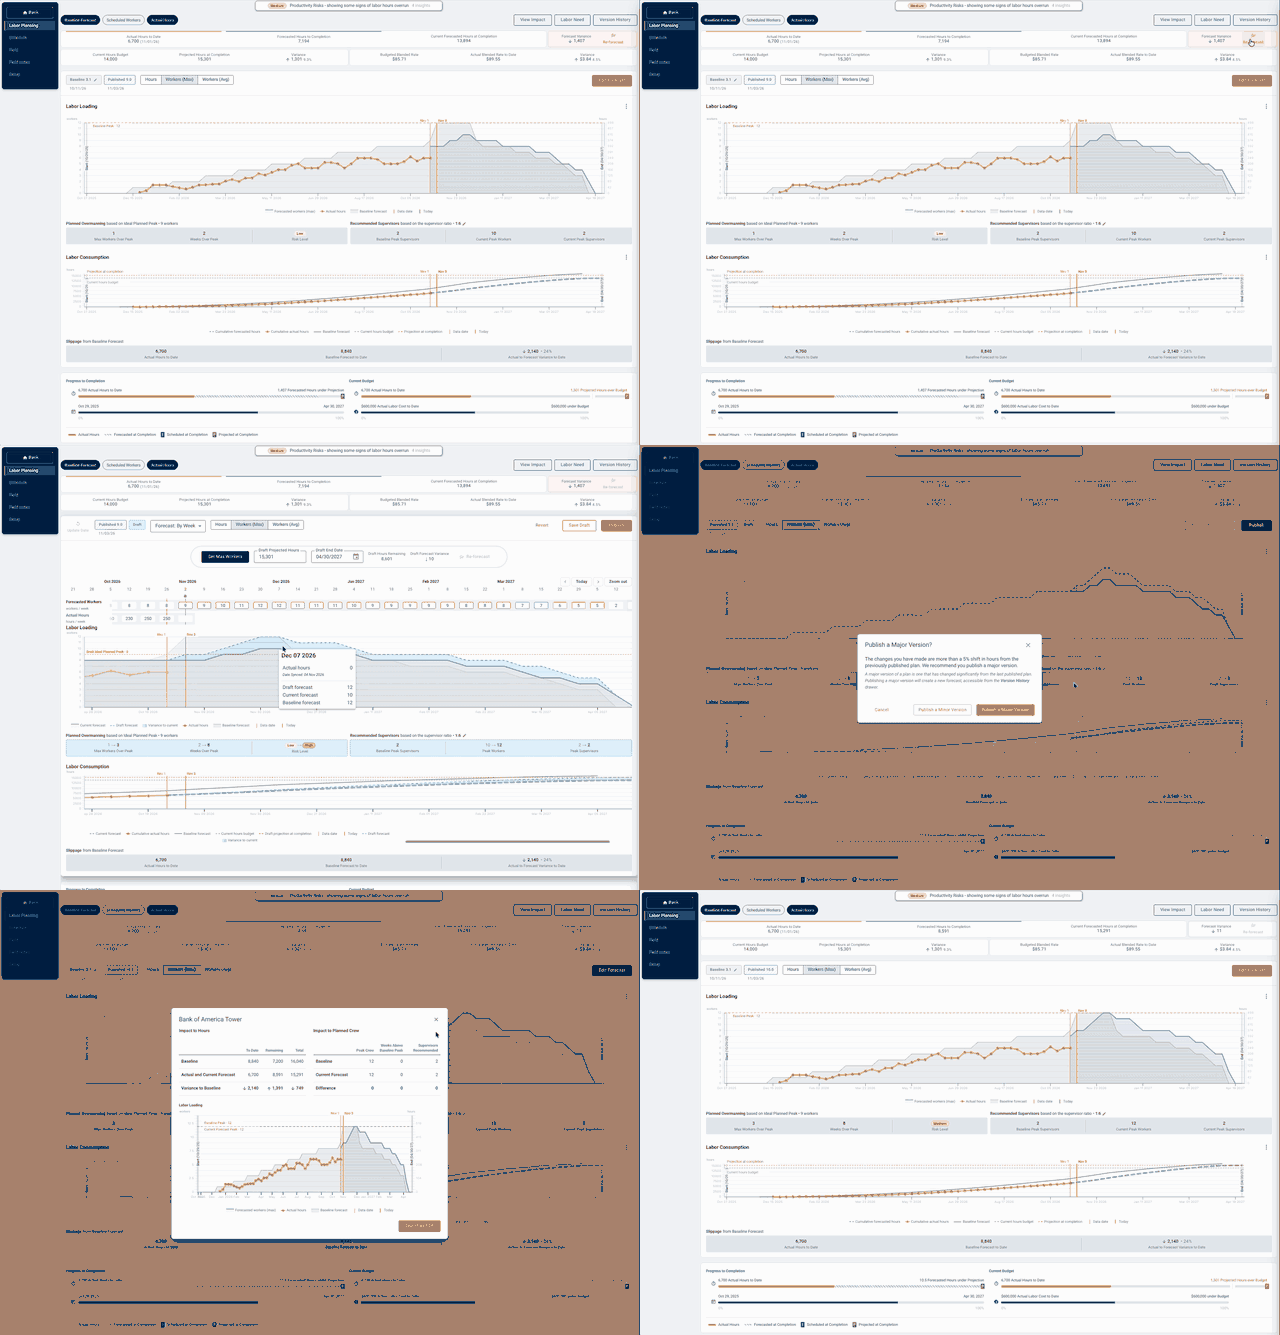
- Top: key metrics read left to right: hours to date, forecasted hours to completion, projected hours at completion and forecast variance, plus budget and blended rates.
- Middle: charts with inline forecast editing. Edit any week right on the page, and it lines up with the same week on the curve.
- Action bar: View Impact, Labor Need and Version History.
- Bottom: progress bars and the labor plan analysis table.
Try it
Open any job in RIVET. The new homepage is already on. For a full walkthrough, see Re-forecasting in RIVET: Labor Planning Homepage Training in the Knowledge Center.
Open a job in RIVET to try it now. Not on RIVET yet? See it in a demo.
Recommended reading
More on the risks a re-forecast helps you see coming.
 ProductProductivity Risks Dashboard & Auto Job ForecastFlag your riskiest jobs and quantify hours at risk before overruns show up in actuals.Read the post →
 Labor planningSchedule Compression Doesn’t Have to Tank MarginsHow labor planning every job helps contractors sidestep compression and protect margin.Read the post →
 Change ordersNavigating Change Orders Without Derailing LaborFour practical tips for absorbing change orders and shifting priorities.Read the post →
 MarginMargin Fade Starts Long Before You Feel ItTwo MEP ops leaders on living forecasts, baselines and finding variance early.Read the post →
Ready to ditch the chaos?
Join specialty contractors just like you who stopped accepting "that's just construction" as an excuse for losing money.

